Technical analysis is the study of financial market action. The technician looks at price changes that
occur on a day-to-day or week-to-week basis or over any other constant time period displayed in
graphic form, called charts. Hence the name chart analysis.
A chartist analyzes price charts only, while the technical analyst studies technical indicators derived
from price changes in addition to the price charts.
Technical analysts examine the price action of the financial markets instead of the fundamental factors that (seem to) effect market prices. Technicians believe that even if all relevant information of a
particular market or stock was available, you still could not predict a precise market “response” to that
information.
There are so many factors interacting at any one time that it is easy for important ones
to be ignored in favor of those that are considered as the “flavor of the day.”
Technical analysis pre-empts fundamental data
Fundamentalists believe there is a cause and effect between fundamental factors and price changes.
This means, if the fundamental news is positive the price should rise, and if the news is negative the
price should fall.
However, long-term analyses of price changes in financial markets around the world
show that such a correlation is present only in the short-term horizon and only to a limited extent. It is
non-existent on a medium- and long-term basis.
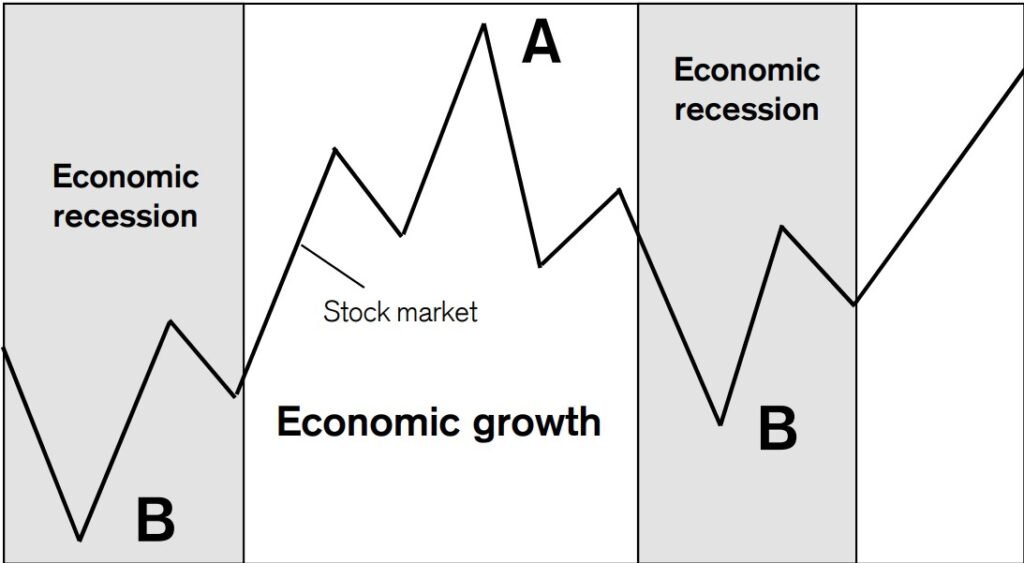
In fact, the contrary is true. The stock market itself is the best predictor of the future fundamental
trend. Most often, prices start rising in a new bull trend while the economy is still in recession (position
B on chart shown above), i.e. while there is no cause for such an uptrend. Vice versa, prices start
falling in a new bear trend while the economy is still growing (position A), and not providing fundamental reasons to sell.
There is a time-lag of several months by which the fundamental trend follows the stock market trend. Moreover, this is not only true for the stock market and the economy, but also for the price trends of individual equities and company earnings. Stock prices peak ahead of peak earnings while bottoming ahead of peak losses.
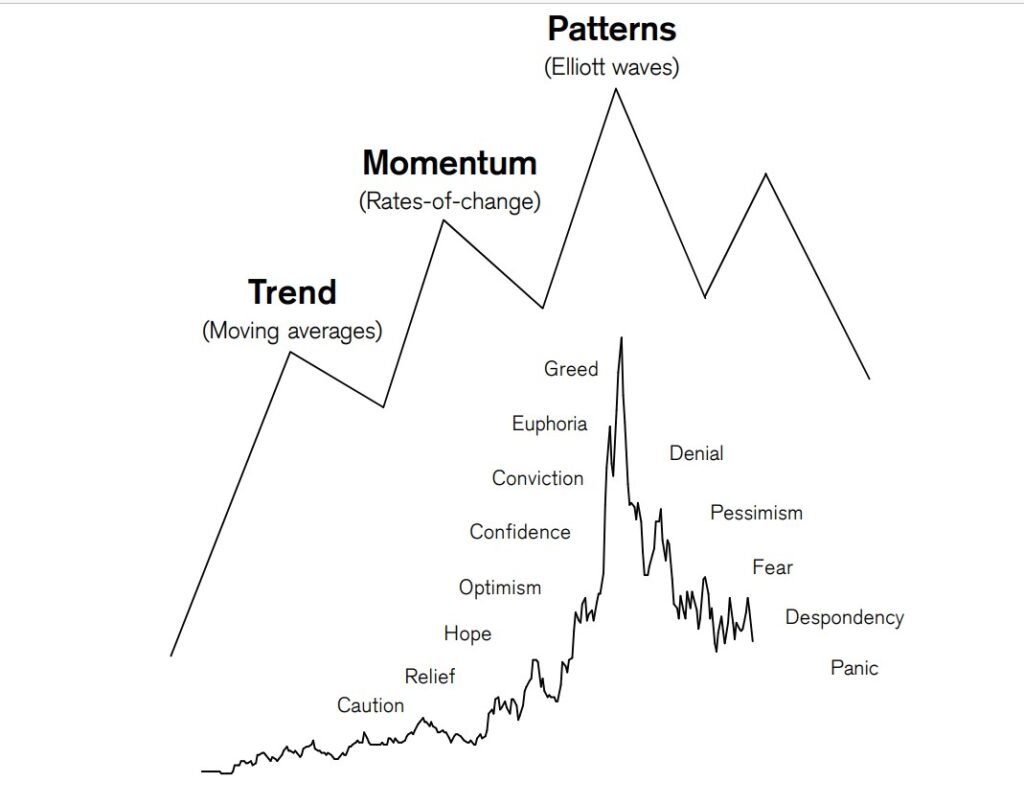
Why aren´t more people making more money in the financial markets?
Because, as we have seen, people are motivated by greed (optimism) when buying and by fear (pessimism) when selling. People are motivated to buy and sell by changes in emotion from optimism to pessimism and vice versa. They formulate fundamental scenarios based on their emotional state (a rationalization of the emotions), which prevents them from realizing that the main drive is emotion.
The chart above shows that if investors buy based on confidence or conviction (optimism) they BUY
near or at the TOP. Likewise, if investors act on concern or capitulation (pessimism) they SELL near
or at the BOTTOM. Investors remain under the bullish impression of the recent uptrend beyond the
forming price top and during a large part of the bear trend.
Vice versa, they remain pessimistic under the bearish impression from the past downtrend through the market bottom and during a large part of the next bull trend. They adjust their bullish fundamental scenarios to bearish AFTER having become pessimistic under the pressure of the downtrend or AFTER having become optimistic under the pressure of the uptrend.
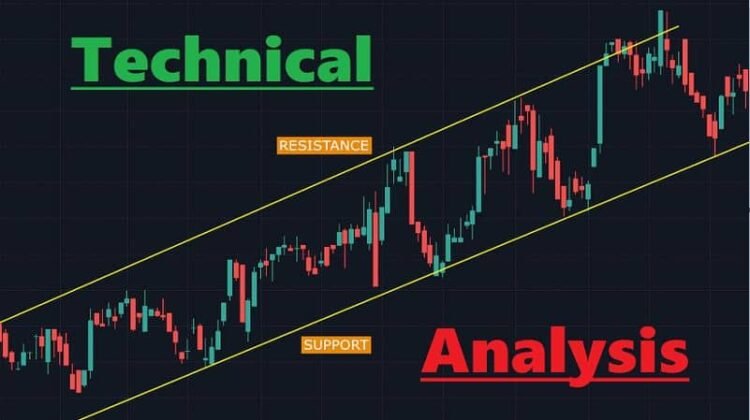
Support and Resistance
Resistance lines are horizontal lines that start at a recent extreme price peak with the line pointing
horizontally into the future. Support lines are horizontal lines that start at a recent extreme of a correction low and also point toward the future on the time axis. An uptrend continues as long as the
most recent peak is surpassed and new peak levels are reached.
A downtrend continues as long as past lows are broken, sustaining a series of lower lows and lower highs. Notice that the previous support often becomes resistance and resistance becomes support.
A resistance or a support line becomes more important and breaks above or below these lines gain more credibility as the number of price extremes (peaks for resistance; or lows for support) that can be connected by a single line increases.
Trendlines
Resistance levels can either be drawn by horizontal lines (as discussed on the previous page) or can
be uptrending or downtrending lines.
The trendline is nothing more than a straight line drawn between at least three points. In an upmove
the low points are connected to form an uptrend line. For a downtrend the peaks are connected. The
important point is that it should not be drawn over the price action. Trendlines must encorporate all of
the price data, i.e. connect the highs in a downtrend and the lows in an uptrend.
Investment horizons
The charts on the previous pages show that investors require perspective. It is imperative to differentiate between a short-term, a medium-term and a long-term trend. If somebody tells you to buy the
US dollar because it is likely to rise, make sure you understand whether the dollar is expected to rise
over a few days or a few months and if you should buy the dollar with the intention to hold it for several
days, several weeks or several months.
For a technician on the trading floor, the long-term horizon is entirely different from that of an institutional investor. For a trader, long-term can mean several days, while for the investor, it can mean 12 to 18 months.
The best investment results are achieved when all three trends on the daily, weekly and monthly
charts point in the same direction.
Moving averages
Moving averages are popular and versatile for identifing price trends. They smooth out fluctuations in market prices, thereby making it easier to determine underlying trends. Their other function is to signal significant changes in direction as early as possible.
The simple moving average is the most widely used. Its calculation is shown above in mathematical form and displayed in the chart on the right. For a 5-day moving average, you simply add the closing prices of the last five closings and divide this sum by 5.
The simple moving average (SMA)
The simple moving average yields the mean of a data set for a given period. For example: a
21- day simple moving average (SMA) would include the last 21 days of data divided by 21,
resulting in an average (see chart above for the Dow Industrial Index).
This can be calculated at any given time using the last 21 days; hence, the average moves forward with each trading day. The moving average is usually plotted on the same chart as price movements, so a change in direction of trend can be indicated by the penetration/crossover of the SMA. Generally a
buy signal is generated when a price breaks above the moving average and a sell signal is generated by a price break below the moving average.
The Elliott Wave Principle
The Wave Principle was Ralph Nelson Elliott’s discovery of how social or crowd behaviour trends and
reverses in recognizable patterns. It is a detailed description of how financial markets behave. The
description reveals that there is a PSYCHE OF THE CROWD inherent in all representative financial
market series. The crowd is not a physical crowd but a psychological crowd.
It constantly moves from pessimism to optimism, from fear to greed and from euphoria to panic and back in a natural psychological sequence, creating specific patterns in price movements. This concept of recursive patterns across finer and finer scales in the financial markets (their fractal nature), was proposed by Elliott in the 1930s, which antedates today’s formal study of non-linear dynamics and chaos.
No Comments
Leave Comment